Chicago Cap Rates
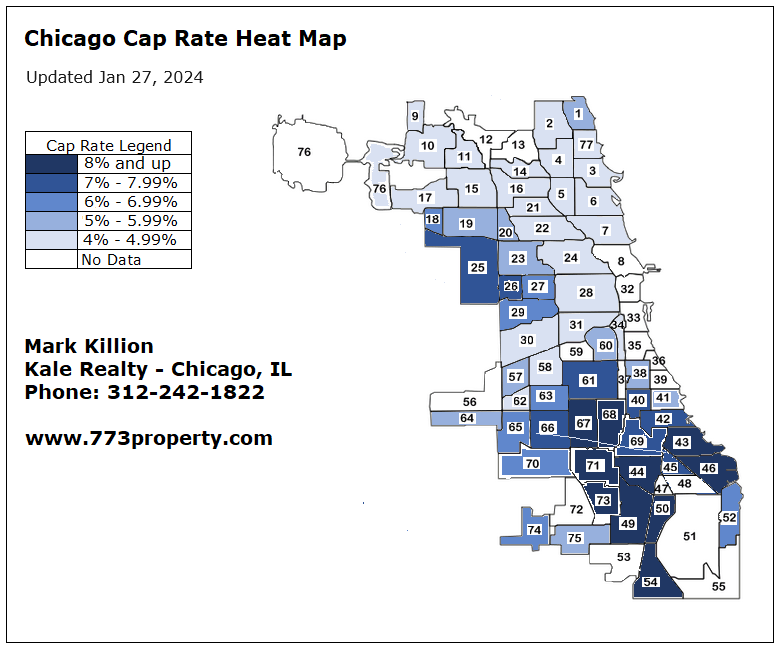
H ello to all my website visitors out there! At the end of this page, you will find a heat map of Chicago Cap Rates by neighborhood!
Map areas with a darker shade of blue have higher cap rates. Map areas with a lighter shade of blue have lower cap rates. If an area has no shade at all, it means there were no multi-family sales in the covered time period.
This analysis covers the 2 year period ended January 26, 2024. It is based on sales of multi-family properties (5+ units). This analysis is based on sales data from the "MRED MLS" system. The MLS is the system used by real estate agents to list and sell properties. Therefore, this analysis would NOT include any property that was sold "off market" (i.e. For Sale By Owner).
What is the average cap rate in Chicago?
For the 2 year period ended January 26, 2024, the average cap rate in Chicago was about 6%.
What is a Cap Rate?
Well, I am glad you asked.Here is a refresher on the concept of Cap Rates:
Cap rate, short for capitalization rate, is a metric used in real estate investing to evaluate the potential return on investment of a property. It's calculated by dividing the property's net operating income (NOI) by its current market value or purchase price.
For a first-time real estate investor, the cap rate is an important factor to consider when evaluating a potential investment property. It helps to determine how much income the property is generating relative to its purchase price. The higher the cap rate, the greater the potential return on investment.
Here's an example to help illustrate the concept:
Let's say you are considering purchasing a rental property for $500,000,
and the annual net operating income is $50,000. To calculate the cap rate,
you would divide the NOI by the purchase price:
Cap rate = NOI / Purchase price
Cap rate = $50,000 / $500,000
Cap rate = 0.1 or 10%
In this example, the cap rate is 10%. This means that the property generates 10% of its purchase price in annual net operating income. A higher cap rate would indicate a better return on investment.
It's important to note that cap rates can vary depending on location, property type, and market conditions. A cap rate that is appropriate for one property or location may not be appropriate for another. Therefore, it's important to conduct thorough research and analysis before making any real estate investment decisions.
Overall, cap rates are a useful tool for first-time real estate investors to evaluate potential investment properties and determine their potential return on investment. However, it's important to consider other factors such as property maintenance costs, vacancy rates, and market trends before making a final decision.
Chicago Cap Rate Analysis
Please keep in mind this is a high level analysis. It should give you a ballpark idea of cap rates in the various Chicago neighborhoods. But some assumptions were made for this analysis.
For example, to determine the net income for a property, I assumed it would be 50% of the Gross Rental Income. Some people cleverly refer to this as the 50% rule :) Also, I tried to weed out properties that require a significant amount of rehab work. Typically those properties will sell below market value and they will make the cap rate look deceptively high.
I spent a lot of time putting this heat map together, so hopefully you find this information useful!
If you are interested in buying or selling investment properties in the Chicagoland area, please send me a message.
Chicago Cap Rate Heat Map
| Area | Neighborhood | Cap Rate |
| 1 | ROGERS PARK | 5.04% |
| 2 | WEST RIDGE | 4.76% |
| 3 | UPTOWN | 3.98% |
| 4 | LINCOLN SQUARE | 4.14% |
| 5 | NORTH CENTER | 4.87% |
| 6 | LAKE VIEW | 4.50% |
| 7 | LINCOLN PARK | 4.31% |
| 9 | EDISON PARK | 4.86% |
| 10 | NORWOOD PARK | 4.02% |
| 11 | JEFFERSON PARK | 4.88% |
| 12 | FOREST GLEN | 2.99% |
| 14 | ALBANY PARK | 4.71% |
| 15 | PORTAGE PARK | 4.94% |
| 16 | IRVING PARK | 4.09% |
| 17 | DUNNING | 4.47% |
| 18 | MONTCLARE | 6.13% |
| 19 | BELMONT CRAGIN | 5.21% |
| 20 | HERMOSA | 5.47% |
| 21 | AVONDALE | 4.57% |
| 22 | LOGAN SQUARE | 4.36% |
| 23 | HUMBOLDT PARK | 5.26% |
| 24 | WEST TOWN | 4.69% |
| 25 | AUSTIN | 7.65% |
| 26 | WEST GARFIELD PARK | 7.52% |
| 27 | EAST GARFIELD PARK | 6.38% |
| 28 | NEAR WEST SIDE | 4.84% |
| 29 | NORTH LAWNDALE | 6.58% |
| 30 | SOUTH LAWNDALE | 4.65% |
| 31 | LOWER WEST SIDE | 4.37% |
| 34 | ARMOUR SQUARE | 4.83% |
| 38 | GRAND BOULEVARD | 5.46% |
| 40 | WASHINGTON PARK | 7.51% |
| 41 | HYDE PARK | 5.94% |
| 42 | WOODLAWN | 7.65% |
| 43 | SOUTH SHORE | 8.02% |
| 44 | CHATHAM | 8.31% |
| 45 | AVALON PARK | 7.84% |
| 46 | SOUTH CHICAGO | 8.37% |
| 49 | ROSELAND | 8.96% |
| 50 | PULLMAN | 8.01% |
| 52 | EAST SIDE | 6.18% |
| 54 | RIVERDALE | 10.88% |
| 57 | ARCHER HEIGHTS | 5.26% |
| 58 | BRIGHTON PARK | 4.19% |
| 59 | MCKINLEY PARK | 2.96% |
| 60 | BRIDGEPORT | 5.06% |
| 61 | NEW CITY | 7.47% |
| 62 | WEST ELSDON | 4.75% |
| 63 | GAGE PARK | 6.81% |
| 64 | CLEARING | 5.05% |
| 65 | WEST LAWN | 6.53% |
| 66 | CHICAGO LAWN | 7.70% |
| 67 | WEST ENGLEWOOD | 10.24% |
| 68 | ENGLEWOOD | 10.65% |
| 69 | GREATER GRAND CROSSING | 7.64% |
| 70 | ASHBURN | 6.87% |
| 71 | AUBURN GRESHAM | 9.59% |
| 73 | WASHINGTON HEIGHTS | 8.15% |
| 74 | MOUNT GREENWOOD | 6.30% |
| 75 | MORGAN PARK | 5.65% |
| 76 | O’HARE | 4.32% |
| 77 | EDGEWATER | 4.43% |
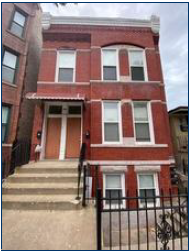
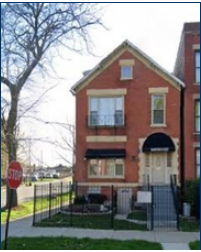
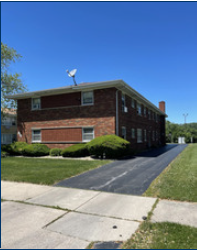
Featured Properties
(listed by Kale Realty)